Every park,
mapped to the species.
A longitudinal field inventory of biodiversity across eleven municipal parks in the Dallas–Fort Worth metroplex. Ten student researchers from Akiba Yavneh Academy. Eleven field days. The first comprehensive baseline of the species — native, naturalized, and invasive — that share North Texas's fragmented urban green space with us.
Species we found.
Every photograph in the inventory was taken by a student researcher in the field and verified by the global iNaturalist community. Twelve standout finds from Year 1 — across plants, insects, birds, mammals, and the canopy that holds them together.
Eastern Cottontail
Sylvilagus floridanus
10 observations
Observed by @arielprimo at Old Renner Park
What ten days in
the field revealed.
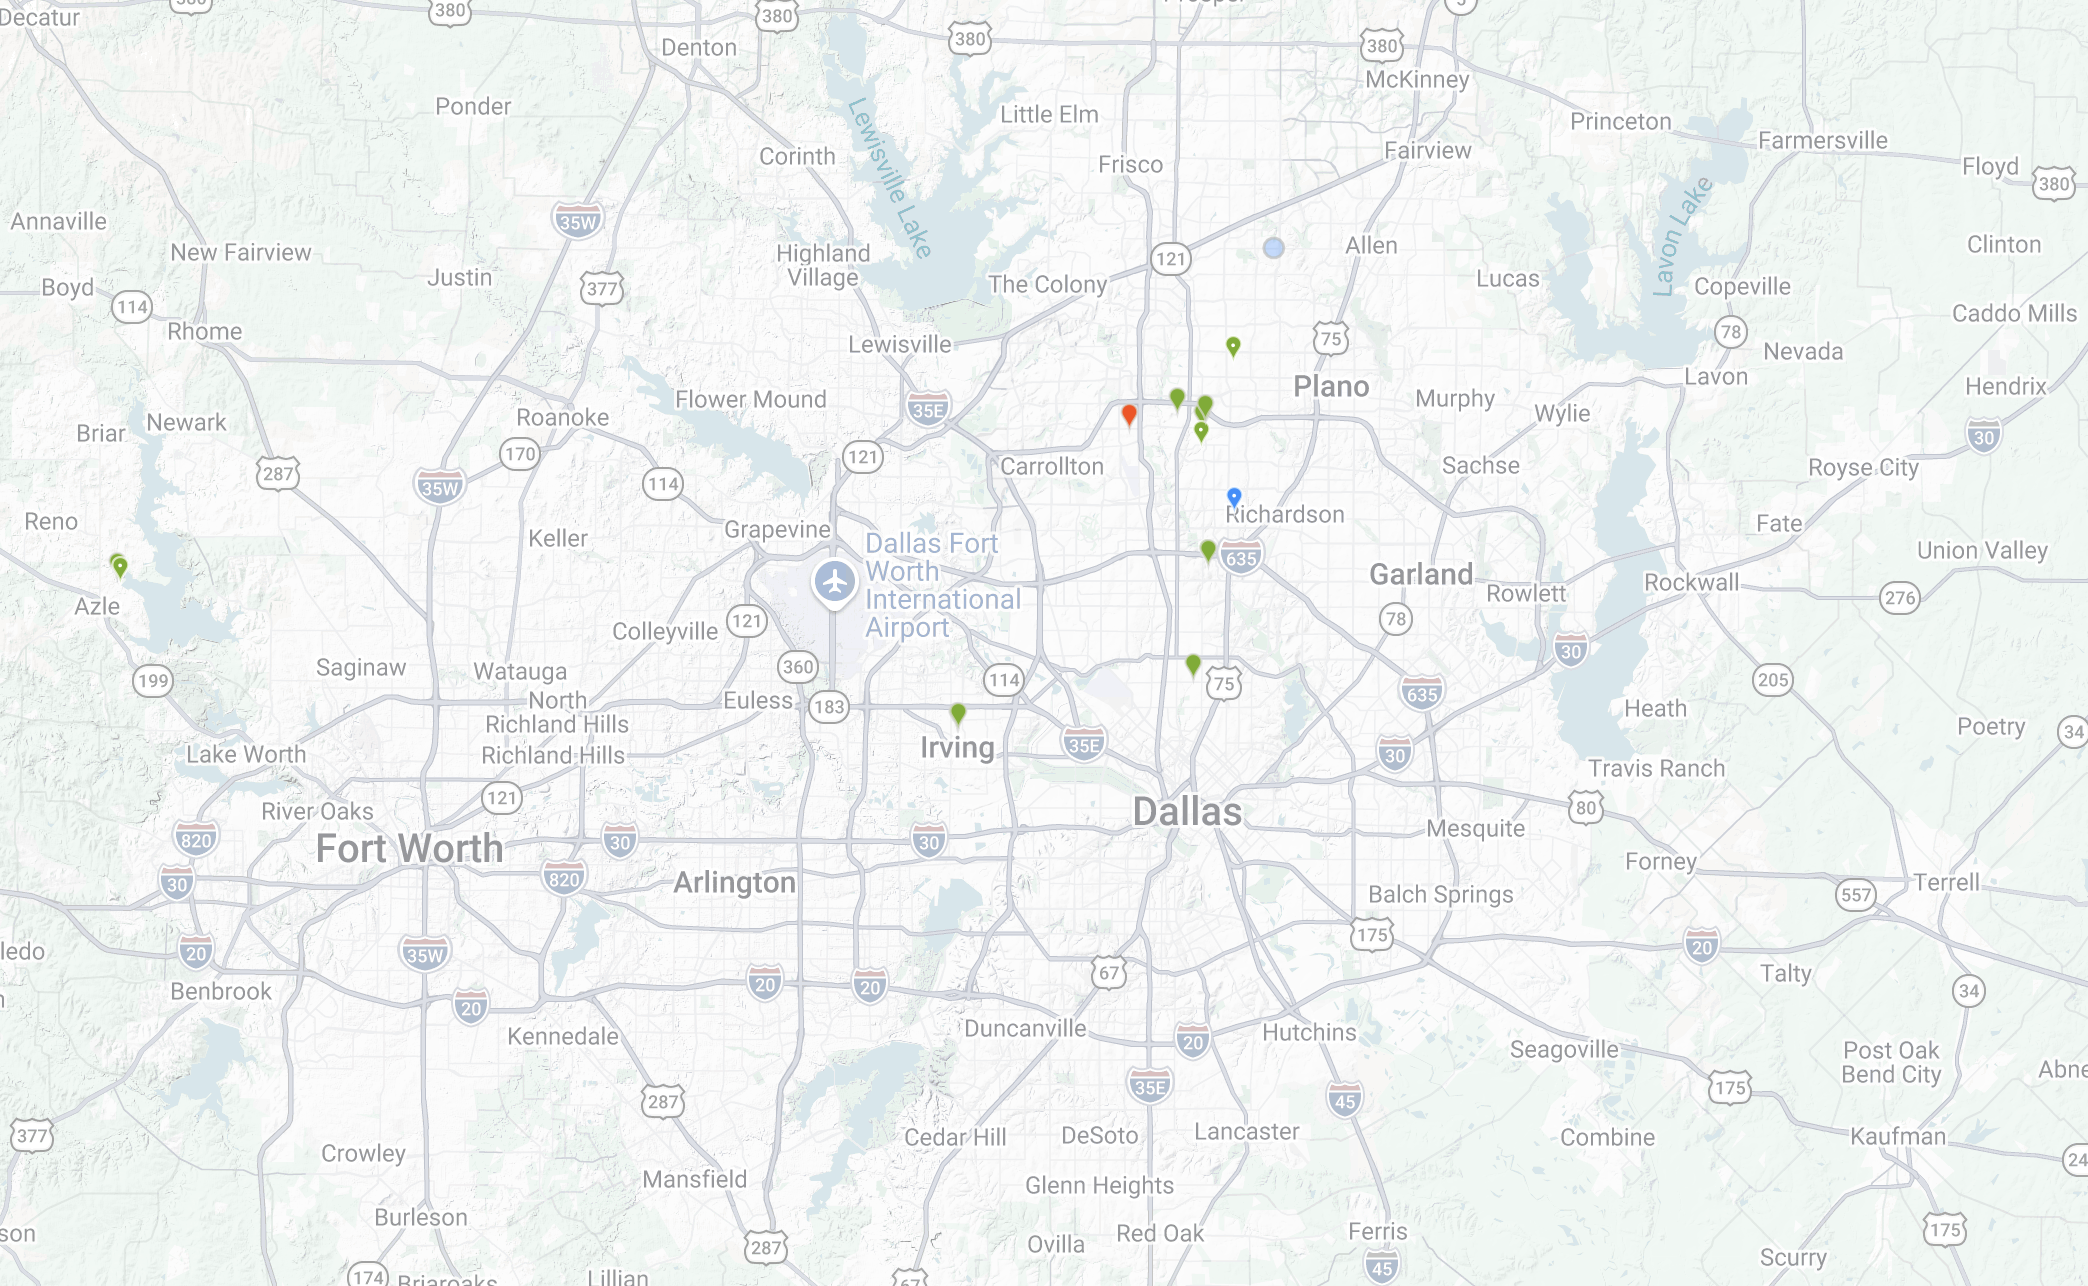
Across eleven parks in five cities, every observation was logged, photographed, and verified by the global iNaturalist community — each site with its own signature, from creek corridors and pond habitats to managed turf and a lakeside cove.
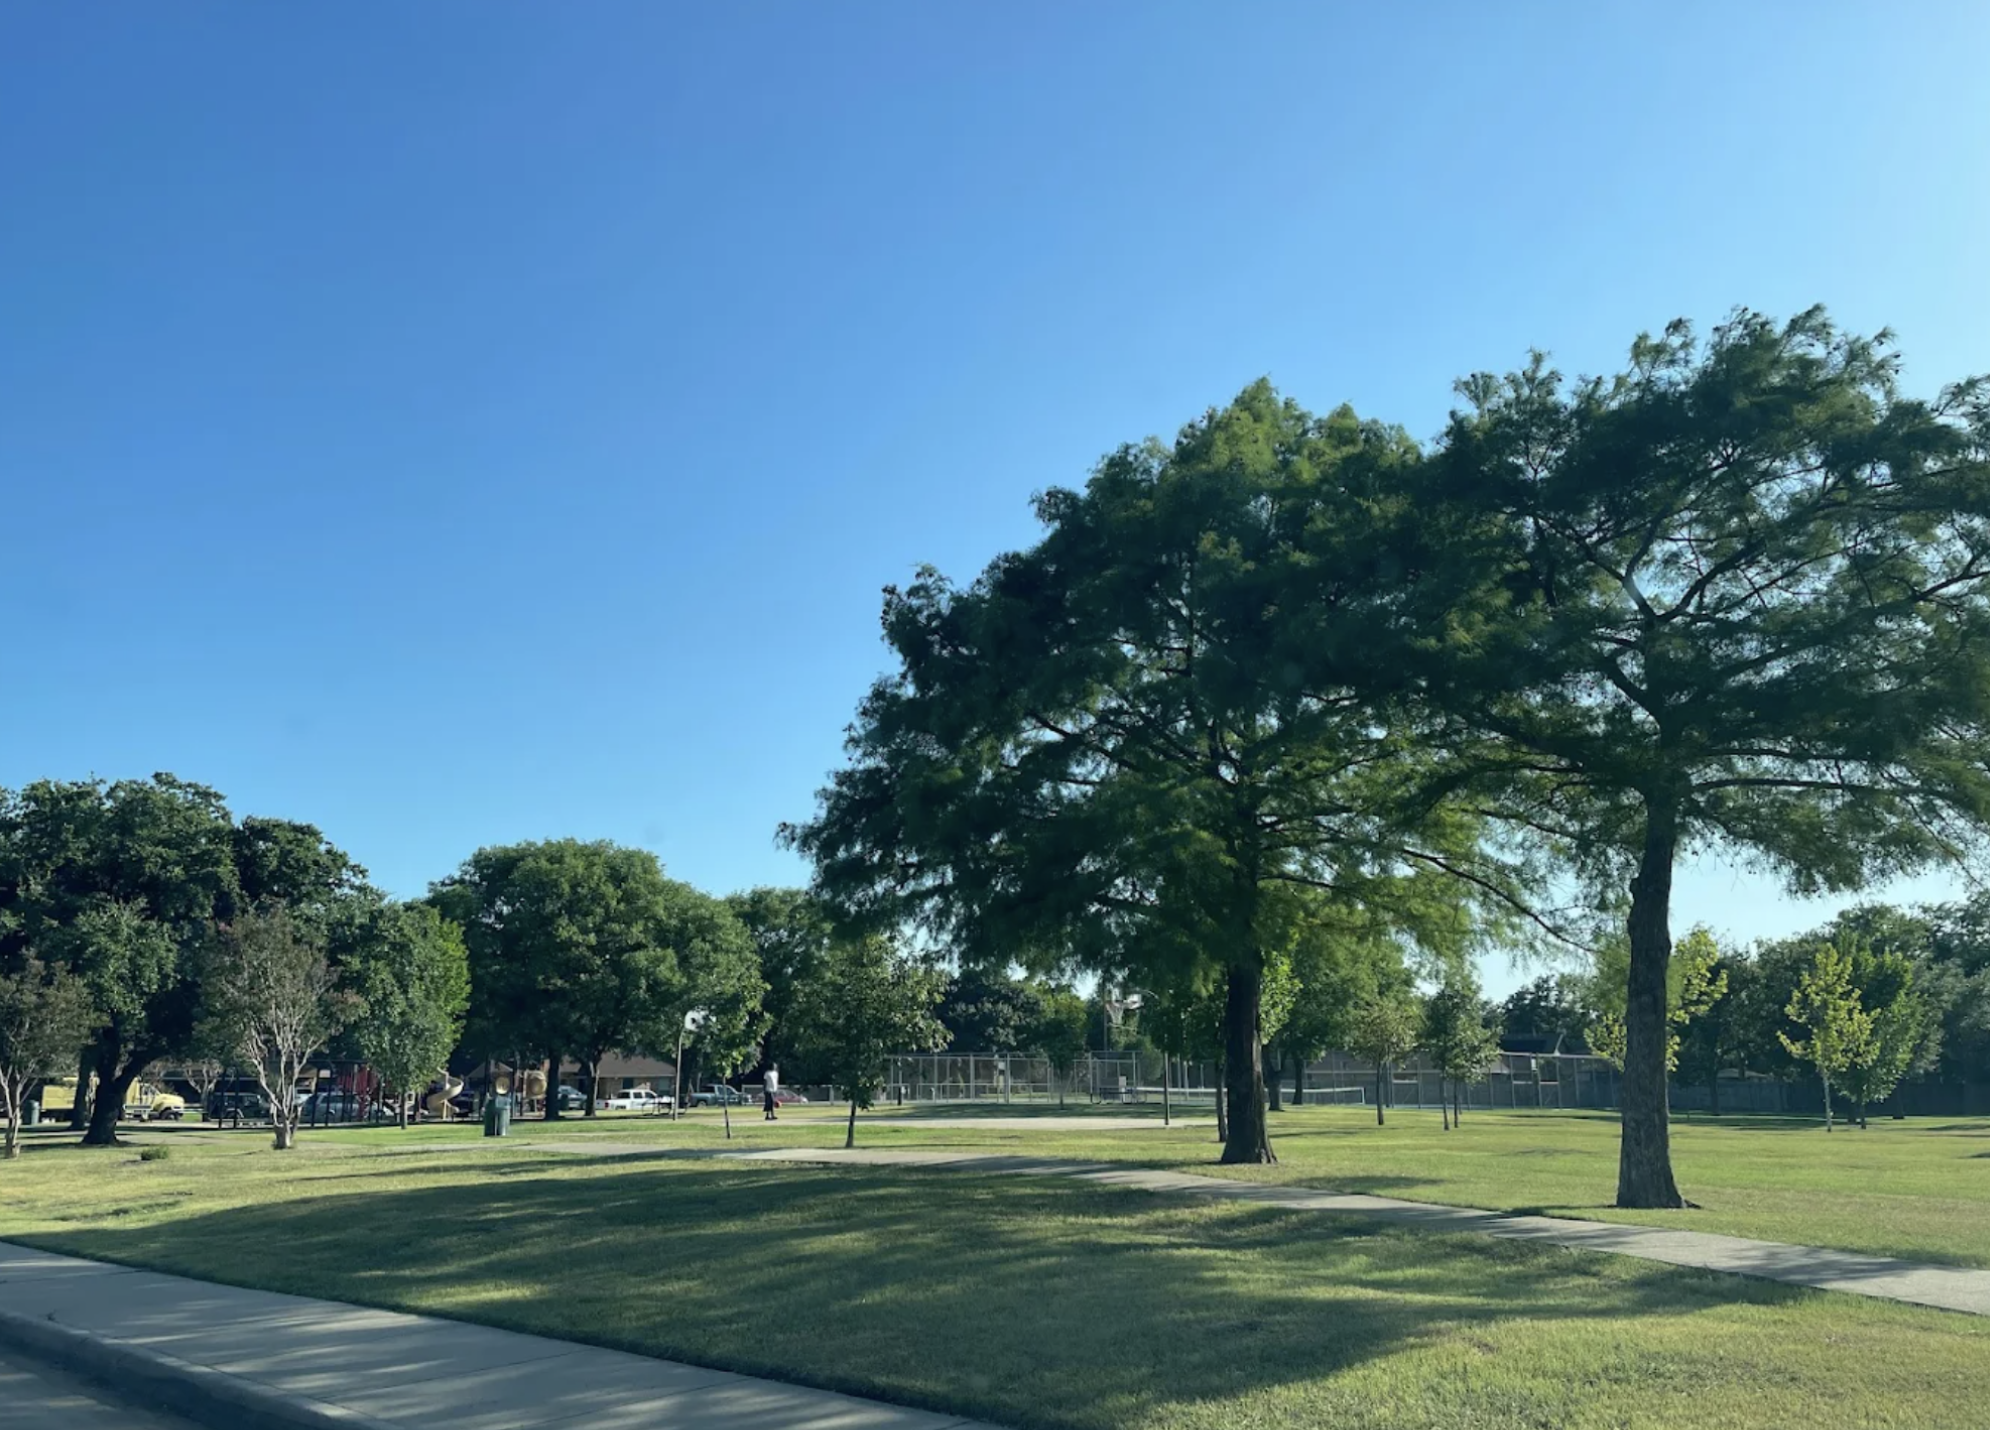 Old Renner Park canopy
Old Renner · Dallas
~190 observations
 Shady Grove shoreline
Shady Grove · Azle
33 observations · Eagle Mountain Lake
 Cottonwood creek
Cottonwood · Richardson
71 observations
 Curtis Park pond
Curtis · University Park
63 observations
 Churchill Park creek
Churchill · Dallas
~97 observations
 Frankford Park woodland
Frankford · Dallas
~32 observations
 Bentwood Park pond
Bentwood · Dallas
~97 observations
 Cheyenne Park turf
Cheyenne · Dallas
~30 observations
 Preston Green meadow
Preston Green · Dallas
~51 observations
 Bent Tree Meadow
Bent Tree Meadow · Dallas
~71 observations
 Lively Pointe pond
Lively Pointe · Irving
~67 observations
853 observations · 221 species across 11 parks in 5 cities.
May 2026
Old Renner Park — survey deployment
The Site
Old Renner anchors the project's Dallas core — a mature-canopy neighborhood park threaded by a creek corridor. Baldcypress, Cedar Elm, and pecan dominate the canopy; the understory carries native woodsorrels, straggler daisy, and roughleaf dogwood.
The Survey
Two coordinated field days, May 17 and May 19, with the full Dallas team. Every plant, insect, bird, and mammal encountered was photographed and uploaded for community verification.
Result
~190
observations logged — the highest of any single park
Notable finds: Eastern Cottontail, Red Imported Fire Ant, chinkapin oak.
How the study works.
NTBI is built to measure change, not just presence — a baseline year, a year of analysis, and an exact replication, so the data shows not only what lives in these parks but how it shifts over time.
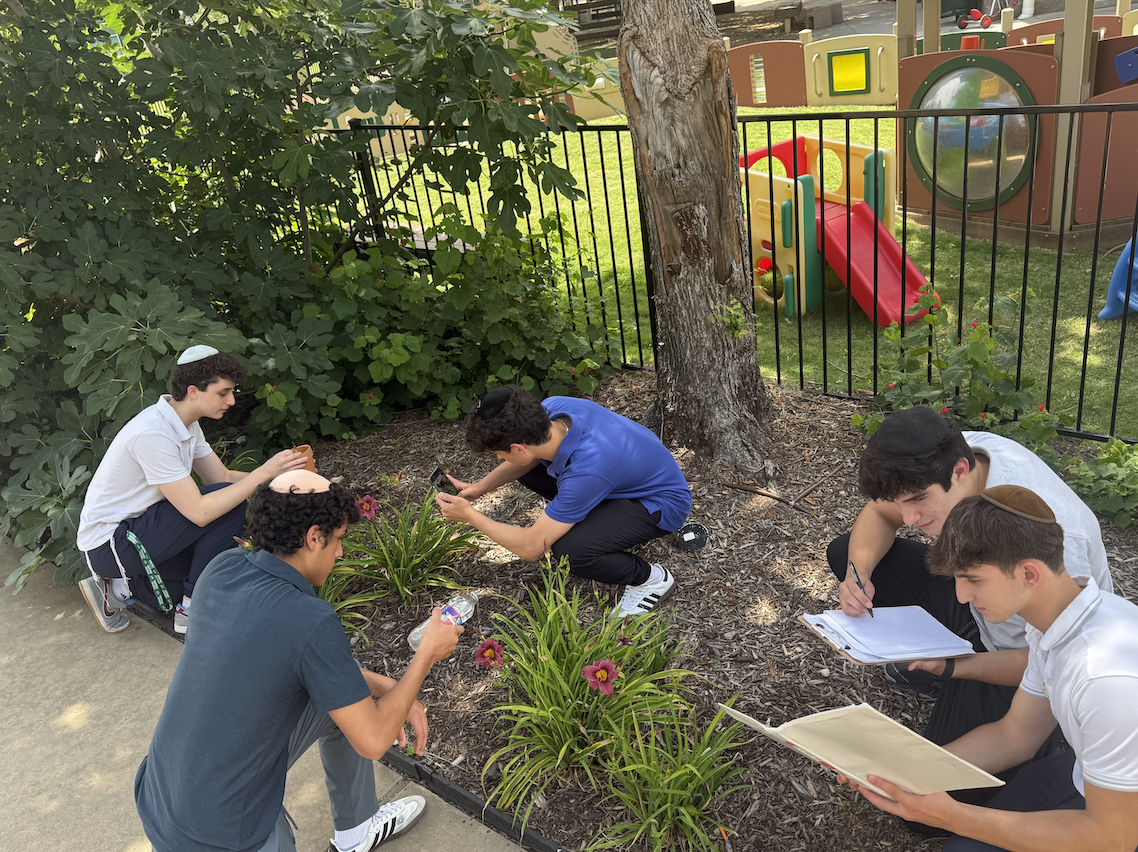
Field deployment · May 2026
Ten students map eleven parks
Across eleven days in May 2026, the team logged 853 observations of 222 species, each photographed and submitted to iNaturalist, where a global community of naturalists independently verifies every identification. That community verification is what makes a youth-led survey scientifically credible.
Analysis & partnerships · 2026–27
A year of analysis and engagement
Between field seasons, the data is analyzed for habitat patterns, invasive pressure, and native canopy health — and shared with municipal partners across five cities to inform local conservation decisions.
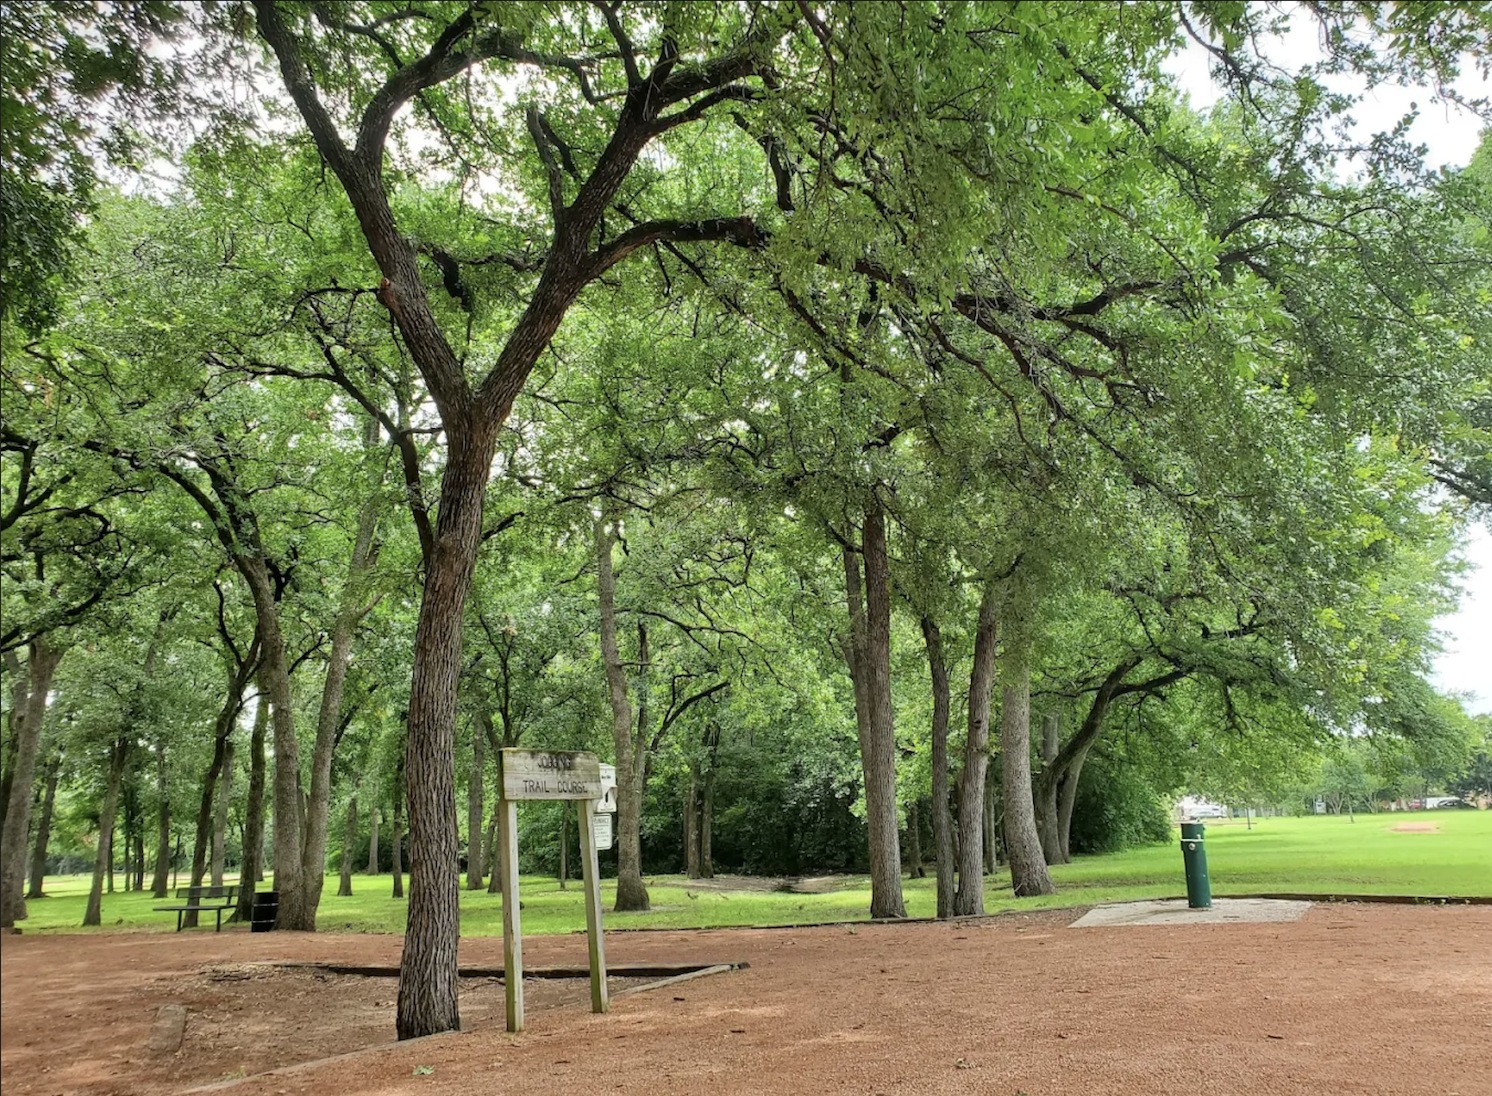
Replication · May 2027
The same parks, surveyed again
In May 2027 the team re-surveys the same eleven parks with the same method. The year-over-year delta — what appeared, what vanished, what spread — is the project's core scientific contribution: a measured picture of ecological change in urban North Texas.
The Year 1 inventory unfolded in partnership with five North Texas municipal governments.
Each park surveyed was endorsed by its city's parks department. Two municipal directors — Shohn Rodgers in Richardson, and Joe Moses in Irving — have personally engaged with the project and are helping shape Year 2 expansion.
Dallas
Parks & Recreation and Development
Endorsed the seven-park Dallas core survey covering the majority of the Year 1 dataset across Churchill, Old Renner, Frankford, Bentwood, Cheyenne, Preston Green, and Bent Tree Meadow.
7 parks · ~619 observations
Richardson
Shohn Rodgers, Parks Department
Endorsed the Cottonwood Park deployment. The riparian-corridor data from this survey will anchor Year 2’s creek-ecosystem analysis.
Cottonwood Park · 71 observations
University Park
Parks Department
Endorsed the Curtis Park deployment. The most ornamentally landscaped site in the inventory, providing a critical baseline for cultivated-versus-naturalized species comparison.
Curtis Park · 63 observations
Azle
Parks Department
Engaged through the Shady Grove Park deployment on Eagle Mountain Lake — a lake-cove and marshland ecosystem unique within the Year 1 inventory.
Shady Grove Park · 33 observations
Irving
Director Joe Moses, Irving Parks Department
Director Moses personally endorsed the project and invited the NTBI research executive to extend the inventory to Irving. Field deployment at Lively Pointe Park added the fifth city to the Year 1 footprint and opens a pathway for collaboration with municipal arborists in Year 2.
Lively Pointe Park · ~67 observations
Ten sophomores from Akiba Yavneh Academy.
The NTBI research executive is composed entirely of high-school sophomores at Akiba Yavneh Academy who chose, outside of any course requirement, to build the first comprehensive baseline of urban biodiversity across the Dallas–Fort Worth metroplex. Each member holds a defined role in field operations, data management, scientific verification, and municipal outreach.
Click or tap a card to view their iNaturalist work
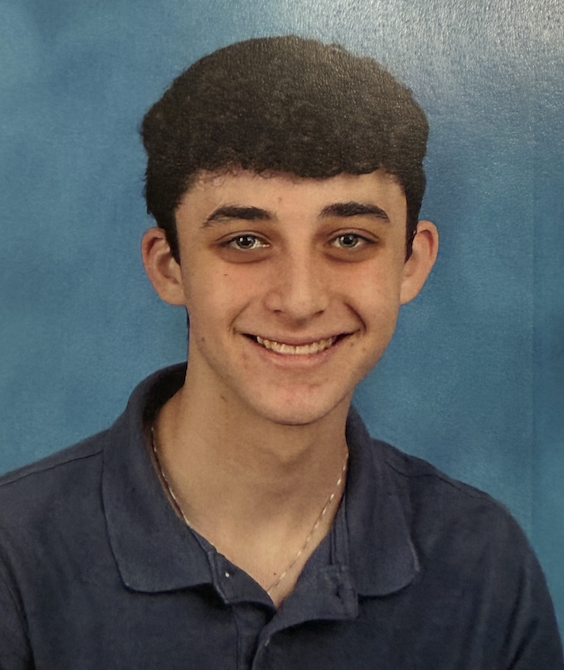
Ariel Davis
Founder & Head Director
I created this group, led it by example, and helped shape it into what it is today. I started it out of a deep interest in biology, a drive to bring communities together through environmental awareness, and a passion for doing my part to make the world a better place.
View Ariel's observations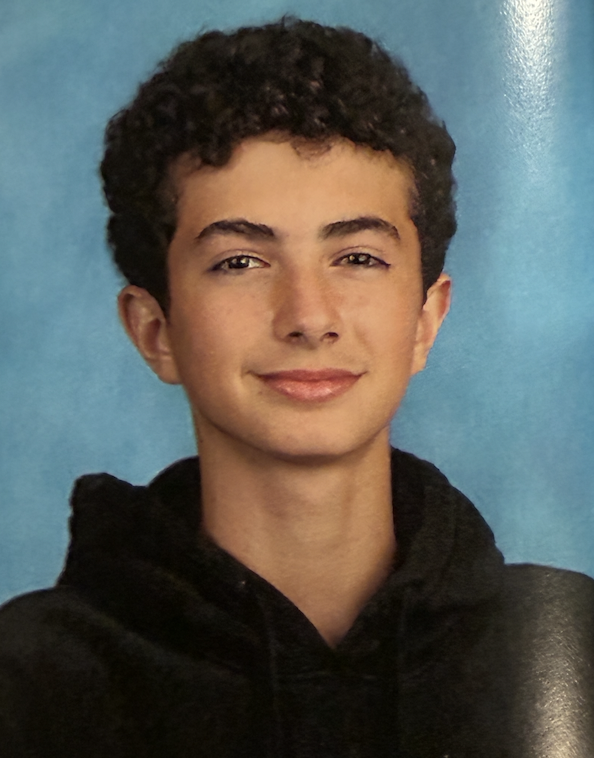
Daniel Ksabi
President & CTO
I oversee the technical backbone of NTBI — the website, our data systems, and the tools that turn thousands of field observations into something the public can explore. Good science deserves to be seen, and technology is how we open our work to the community.
View Daniel's observations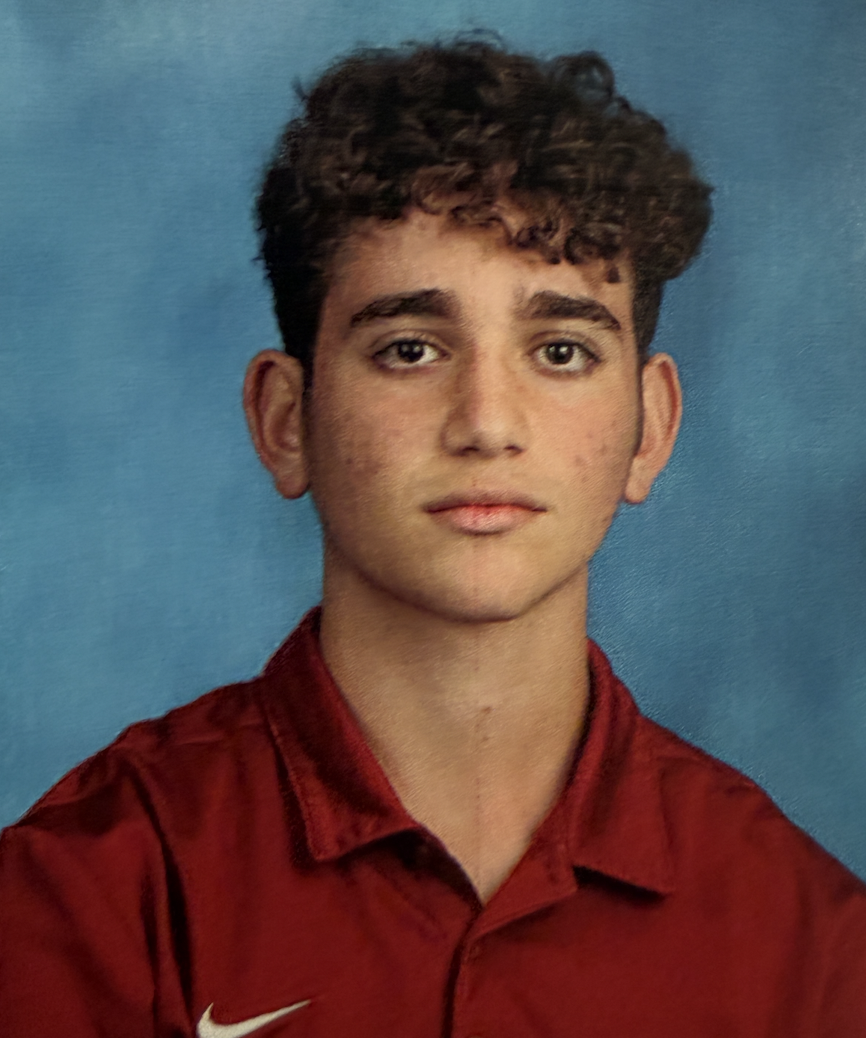
Ariel Primo
Vice President · CFOO
I oversee our field operations and logistics — coordinating teams, managing resources, and making sure every survey runs smoothly from planning to upload. Careful organization is what turns ambitious environmental goals into real, measurable results.
View Ariel's observations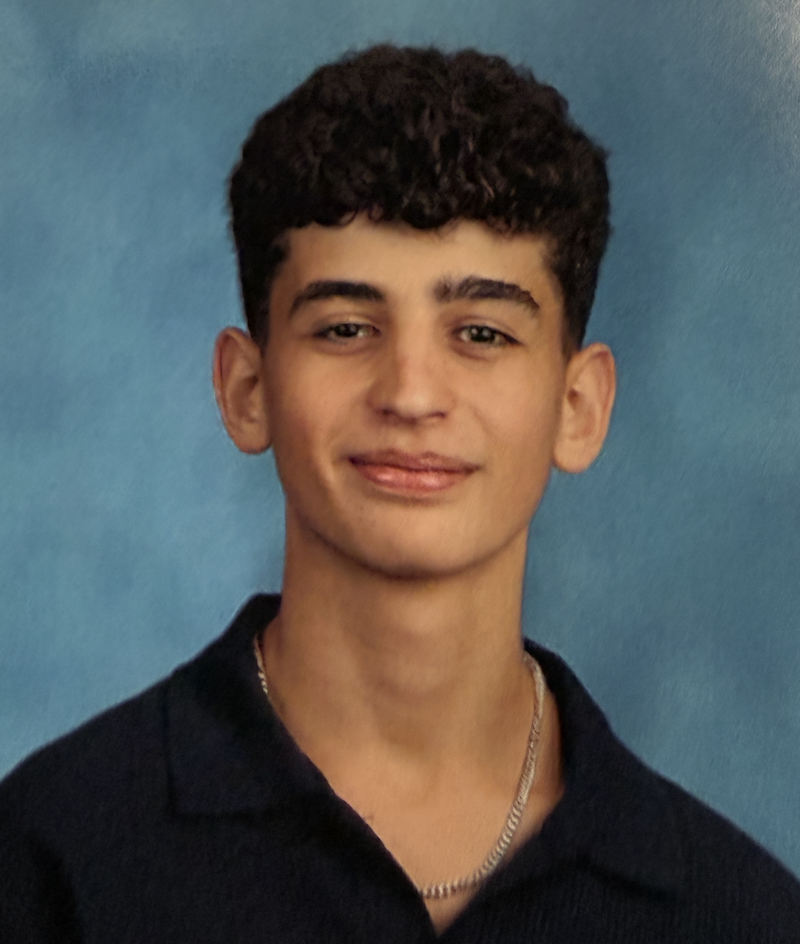
Jonathan Sharvit
Chief Scientific Officer & Head Researcher
I lead the scientific vision behind our survey — shaping how we observe, verify, and interpret what we find in the field. Strong scientific leadership is the foundation of meaningful discovery; without it, great ideas never become real solutions.
View Jonathan's observations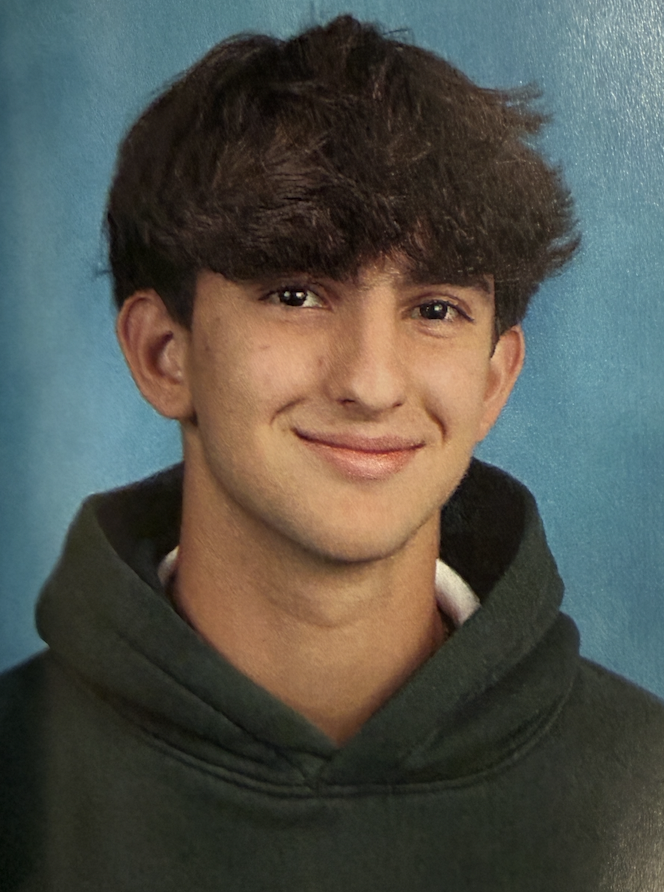
Shaun Nadato
Quality & Peer-Review
I check the accuracy of every observation before it enters our dataset — confirming identifications, catching errors, and holding our records to a standard the scientific community can trust. Reliable data is what separates real research from a collection of photos.
View Shaun's observations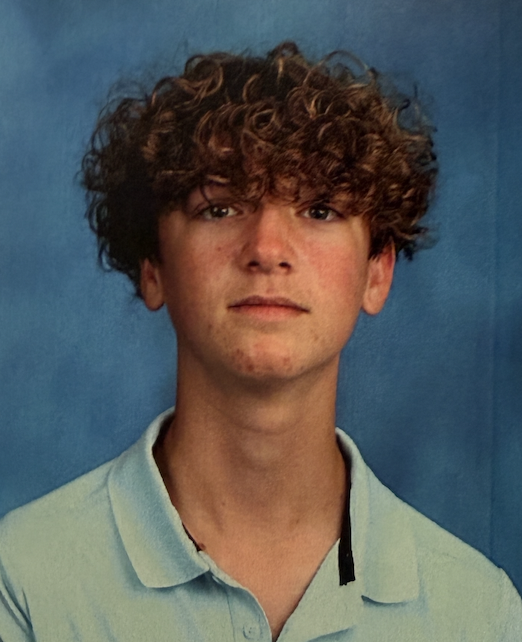
Hayden Insel
GIS Analyst & Mapping Specialist
I mapped every park zone and organized our location data into clean, reliable spreadsheets for the team — making sure each survey area was accurately identified and easy to analyze. Good science depends on knowing exactly where every observation comes from.
View Hayden's observations
Jacob Gorny
Chief Editorial Officer & Lead Writer
I shape how NTBI tells its story — turning our data and findings into clear, accurate writing that anyone in the community can follow. Research only matters if people can understand it, and good writing is how our science reaches the public.
View Jacob's observations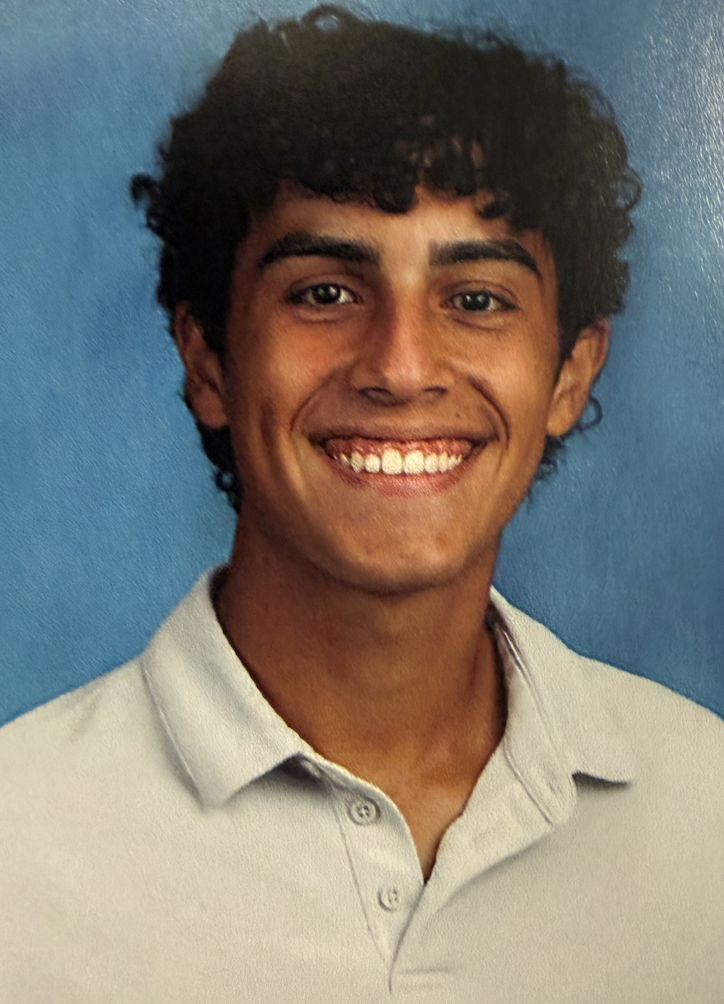
Idan Rahamim
Communications & Municipal Liaison
I connect NTBI with the cities and parks departments whose land we survey — coordinating outreach, building partnerships, and making sure our findings reach the people who manage these spaces. Local biodiversity work has the most impact when it's shared directly with the community.
View Idan's observations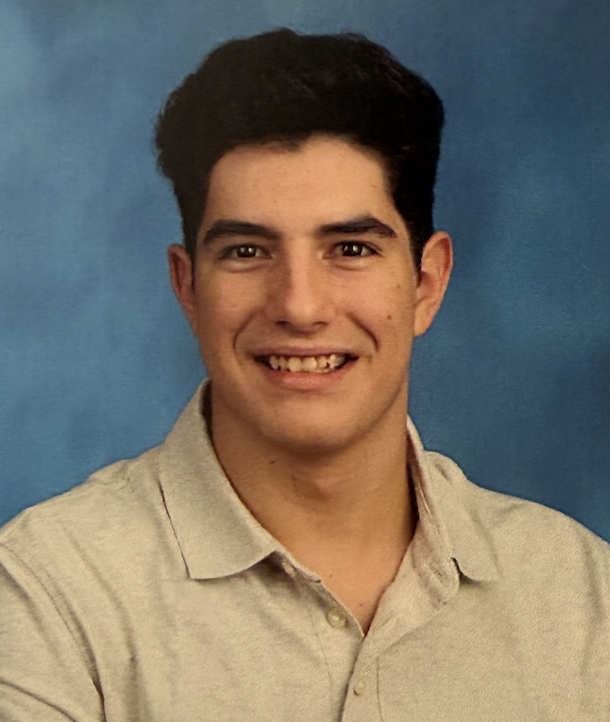
Mikhael Kamshad
Field Director · Dallas Sector
I handpicked the most diverse and biologically rich parks the Dallas area had to offer and led our surveys through them. I've always been drawn to both leadership and environmentalism, so this role was the perfect chance to explore those interests while giving back to my community.
View Mikhael's observations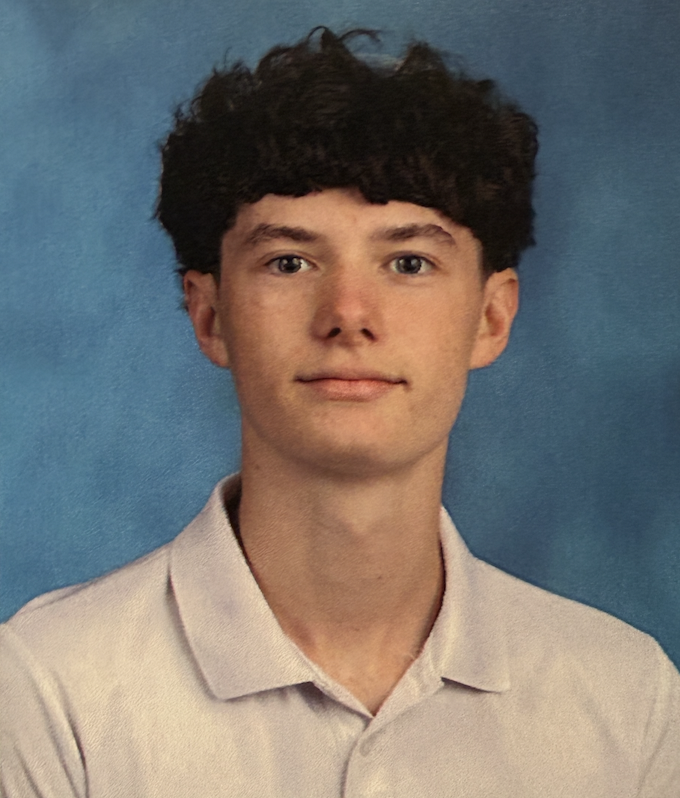
Ben Bernstein
Field Director · Suburban Sector
I led our surveys across the parks beyond Dallas proper — from Richardson and University Park to Irving and Azle — making sure each site was covered as thoroughly as our urban core. Biodiversity doesn't stop at the city line.
View Ben's observationsJoin the network.
NTBI is building a community of people who care about urban biodiversity. Sign up to be counted — and to stay connected as our work grows.
Your information is stored securely and will only be used to keep you informed about NTBI's work.
Reach the research executive directly.
For municipal partnership inquiries, academic research collaboration, press requests, or general questions about the dataset, write to us. A member of the NTBI executive will respond within seven days.
Five cities now.
Help us map the rest.
The Year 1 baseline is complete and public. For Year 2, we're inviting more North Texas municipalities to bring their parks into the inventory — and more arborists, ecologists, and educators to help verify and expand the data. The dataset is open to everyone, today.
View the inventory on iNaturalist